Loading…

Data Visualization Project

Titanic Survival Analysis

Automated bulk email messaging using Excel/CSV data — smart, fast, reliable.

Titanic Survival Analysis project output screenshot

Overview

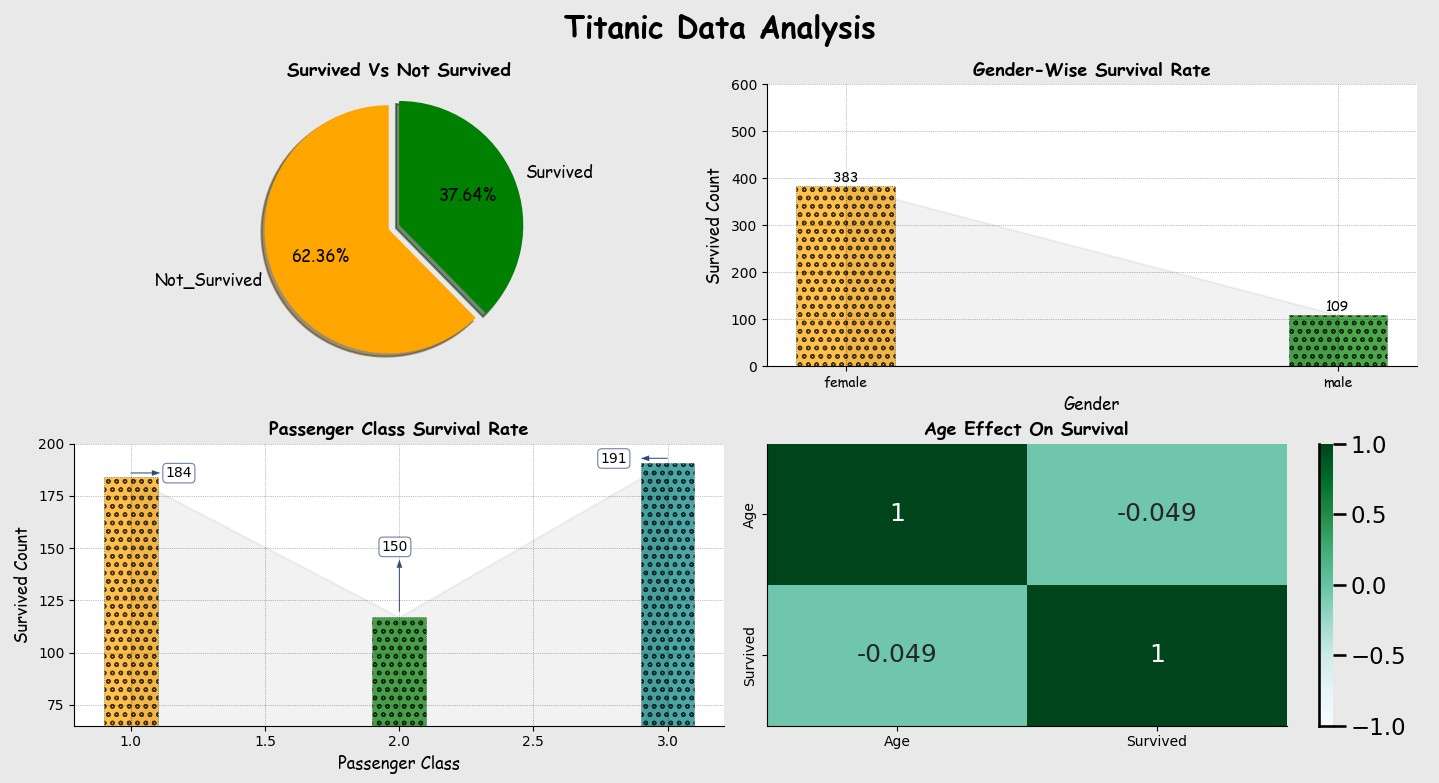
This project explores the Titanic dataset to analyze survival patterns and key demographic factors influencing passenger outcomes. The data was cleaned, merged, and visualized to understand relationships between survival rate, gender, passenger class, and age. The analysis focuses on deriving clear insights through effective data handling and storytelling visualizations using Pandas, Matplotlib, and Seaborn.

Key Features

  • Combined and cleaned multiple Titanic CSV files (train, test, and gender submission) into a single dataset.
  • Removed duplicates and handled missing values in Age, Fare, and Embarked columns.
  • Converted data types for consistency and accuracy in analysis.
  • Calculated overall survival vs non-survival ratios with a clear visual comparison.
  • Compared gender-based and class-based survival rates using bar charts and annotations
  • Examined age correlation with survival, showing that younger passengers had higher survival chances
  • Created a heatmap to visualize relationships between variables
  • Delivered clean, minimal, and high-quality plots suitable for storytelling and presentation

Screenshots

× Zoomed Project Image