Loading…

Data Visualization Project

Netflix Dataset Analysis (1925-2021)

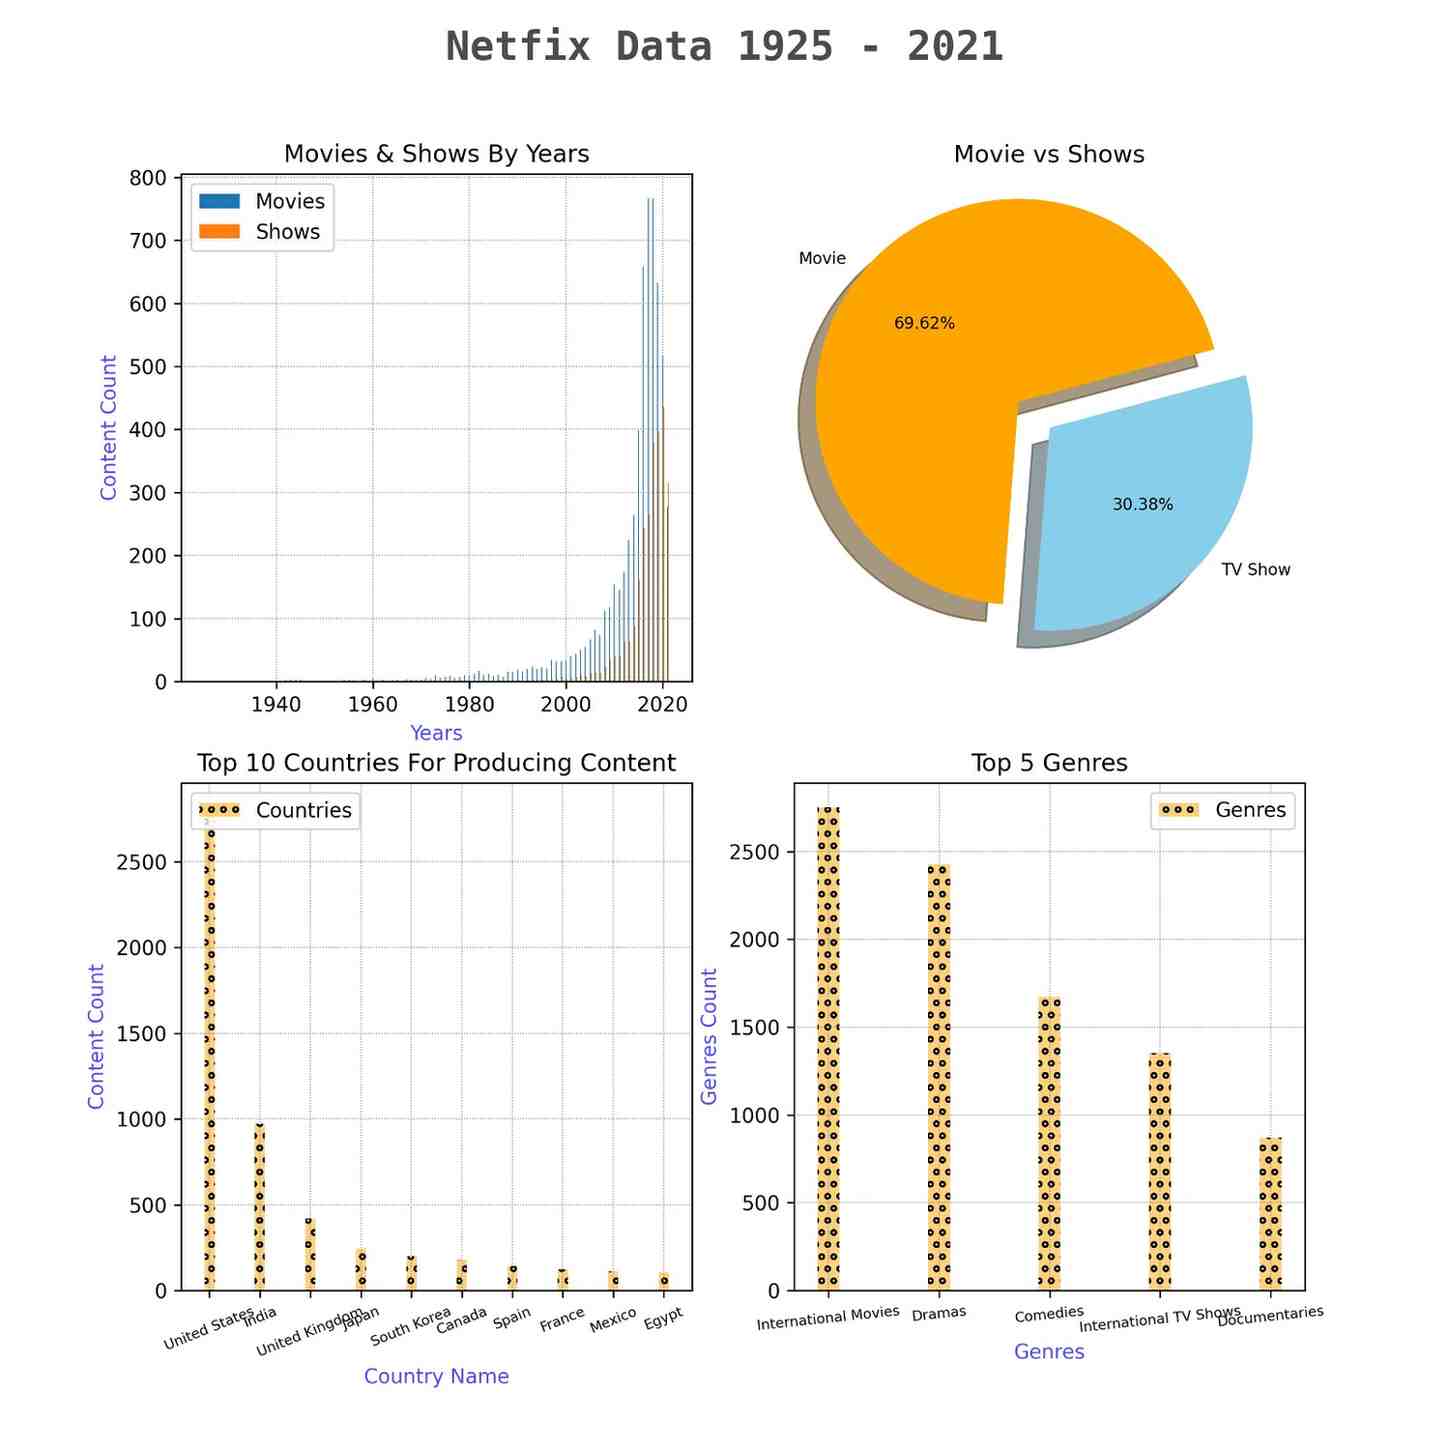
Analyzed Netflix dataset (1925–2021) for content and genre trends.

Netflix Dataset Analysis (1925-2021) project output screenshot

Overview

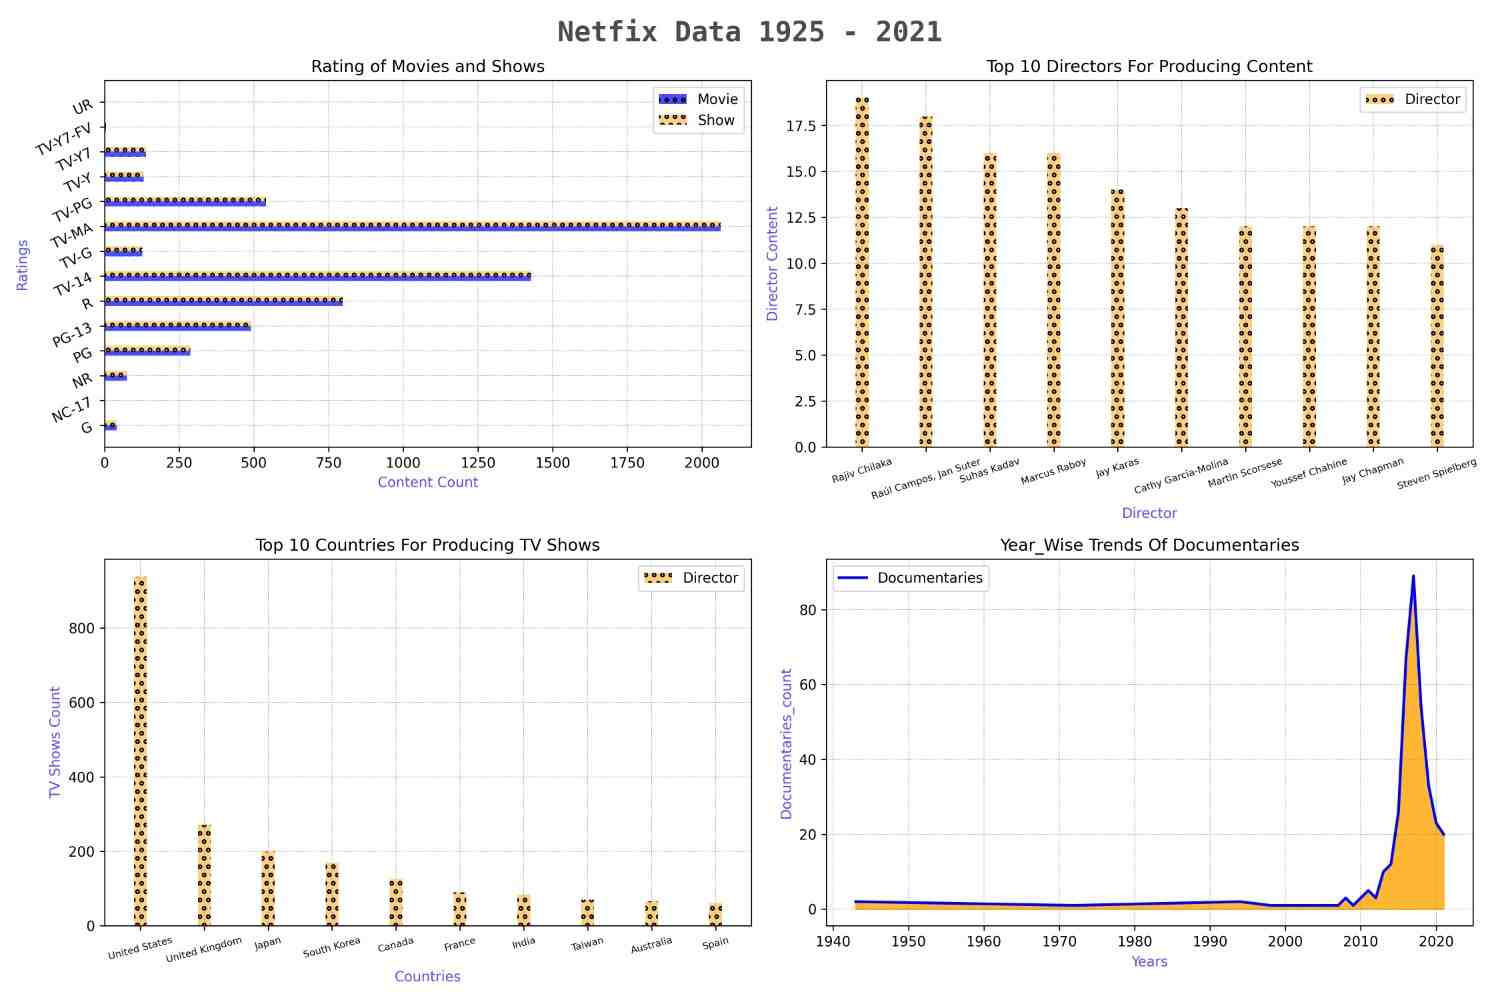
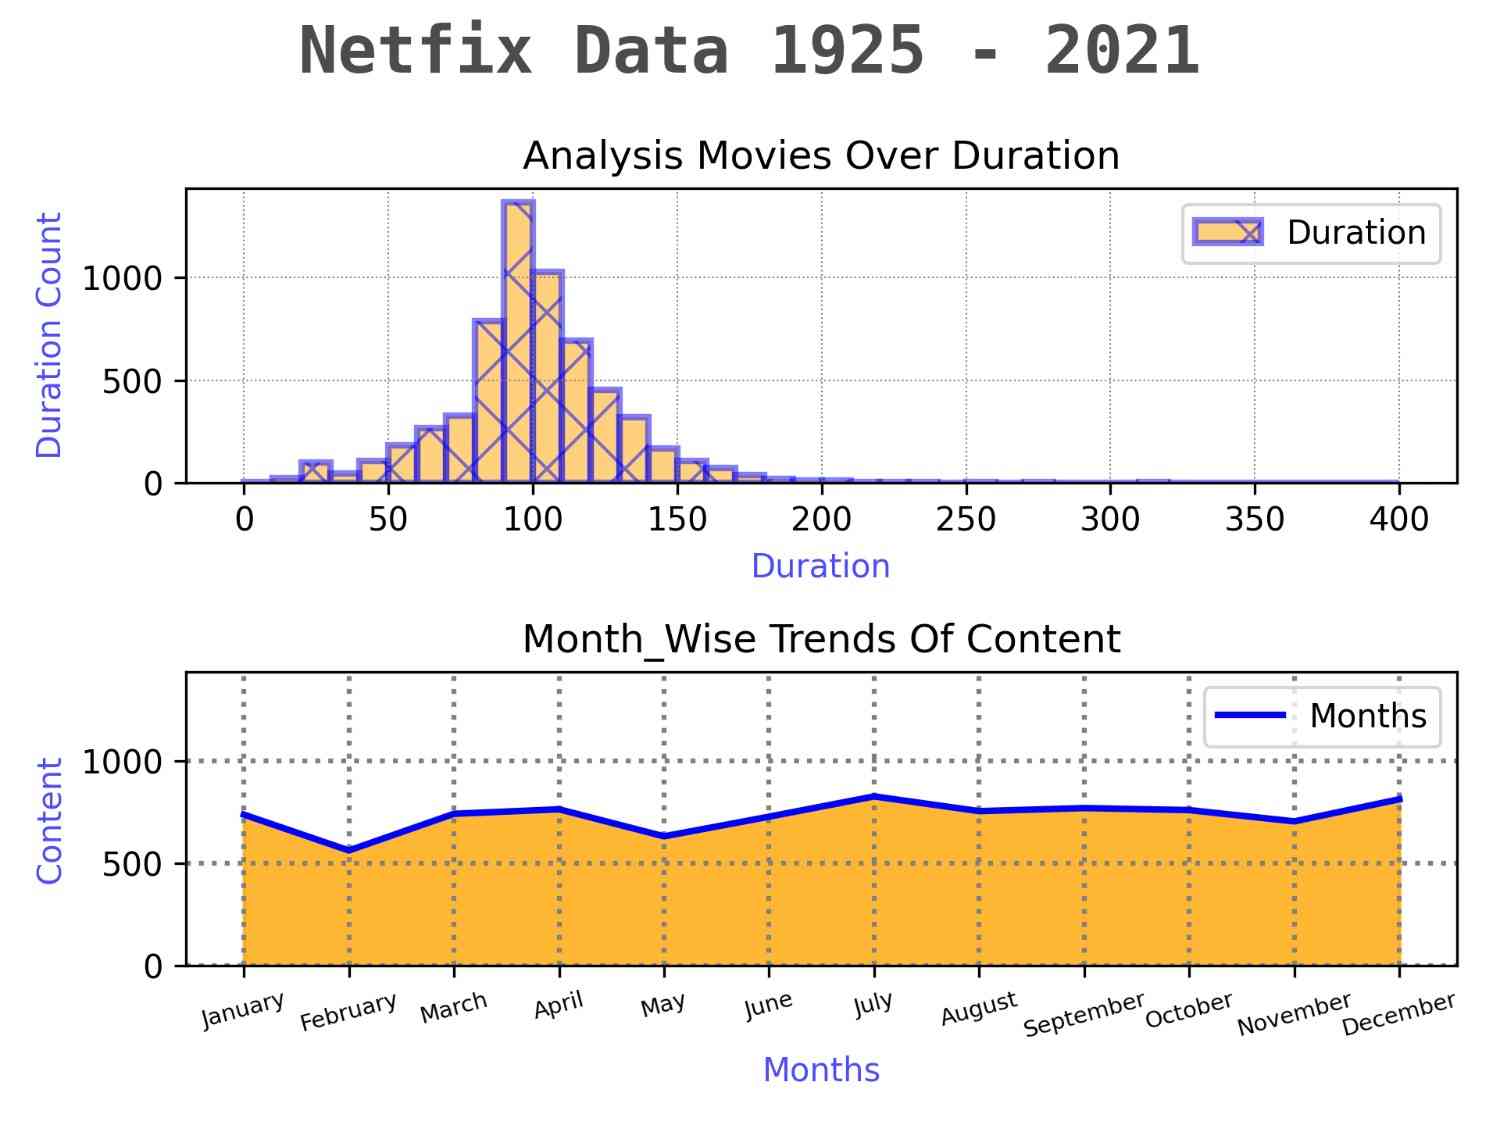
This project explores Netflix’s global content catalog to analyze trends in movies and TV shows from 1925 to 2021. The dataset was cleaned, transformed, and visualized to uncover insights about yearly releases, country-wise contributions, ratings, genres, and content duration patterns. The goal was to identify how Netflix’s content evolved over time through data-driven storytelling using Pandas, Matplotlib, and Numpy.

Key Features

  • Cleaned and prepared Netflix dataset by removing duplicates and handling null values.
  • Analyzed year-wise movie and show releases to identify growth trends
  • Compared content type distribution (Movies vs TV Shows) using visual proportions
  • Highlighted top 10 countries contributing the most Netflix content
  • Identified top 5 genres dominating Netflix’s library.
  • Explored content ratings and director-based distribution for deeper insight.
  • Visualized TV show trends by country and year-wise documentary releases.
  • Analyzed movie duration distribution and monthly release trends.
  • Designed clear, labeled, and presentation-ready visuals for storytelling.

Screenshots

× Zoomed Project Image