Overview
This project analyzes the Online Retail dataset to identify key customer groups and revenue patterns through RFM (Recency, Frequency, Monetary) analysis.
It includes complete data preprocessing, feature engineering, customer segmentation, and visualization.
The analysis helps businesses understand customer behavior, detect high-value clients, and optimize retention strategies using Python libraries like Pandas, Seaborn, and Matplotlib.
Key Features
- Cleaned and transformed the dataset by removing duplicates, missing values, and invalid transactions.
- Calculated RFM metrics (Recency, Frequency, Monetary) for each customer using transaction data.
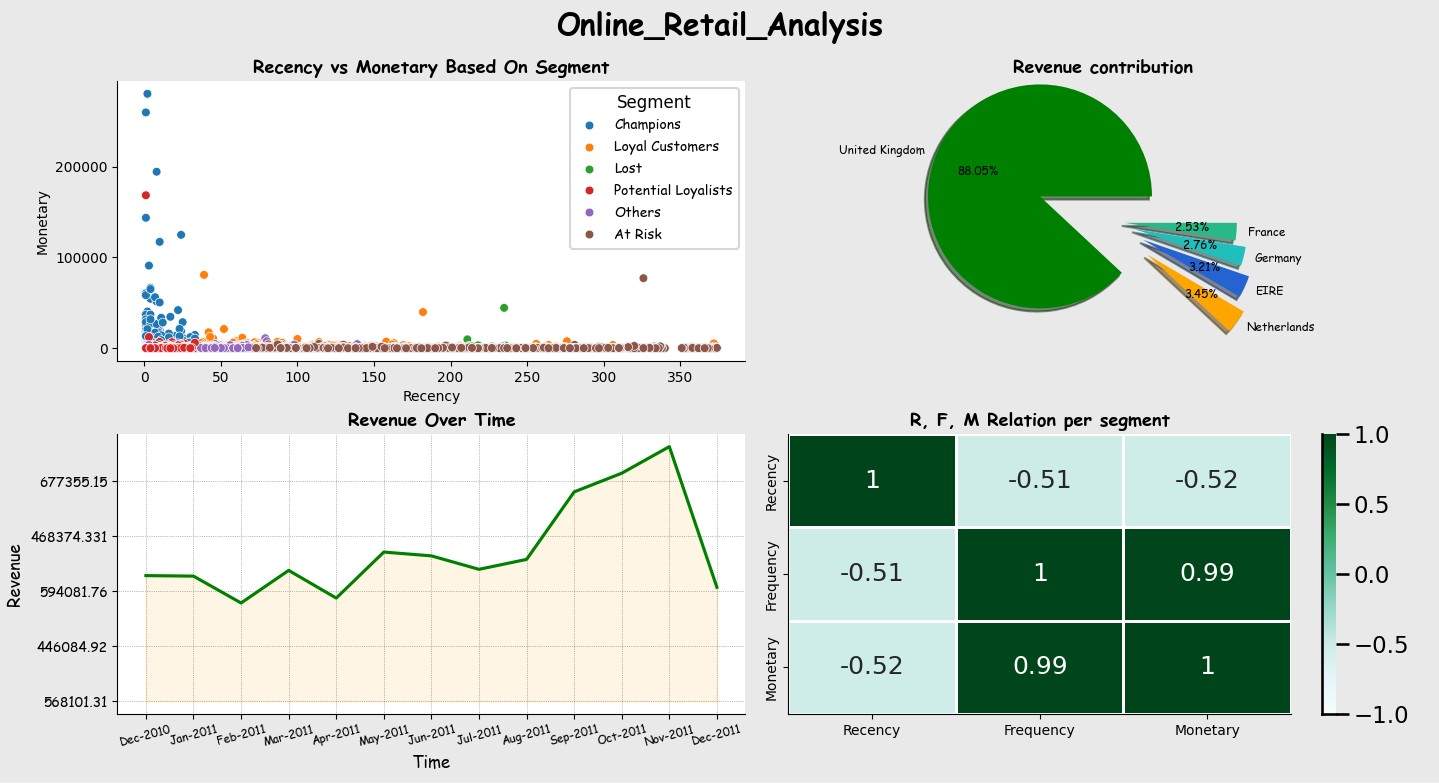
- Segmented customers into groups such as Champions, Loyal, Potential Loyalists, At Risk, and Lost.
- Created RFM scoring system using quantile-based binning for customer ranking.
- Analyzed revenue contribution by country through pie charts.
- Tracked monthly revenue trends to visualize business growth over time.
- Plotted Recency vs Monetary scatterplots to identify top-performing customer segments.
- Used heatmaps to explore correlations between RFM metrics.
- Delivered clear, insight-driven visuals with a clean and consistent design.
Screenshots
×
![Zoomed Project Image]()