Loading…

Data Visualization Project

Google Play Store Dataset Analysis

Analyzed Google Play Store dataset to identify app trends and insights.

Google Play Store Dataset Analysis project output screenshot

Overview

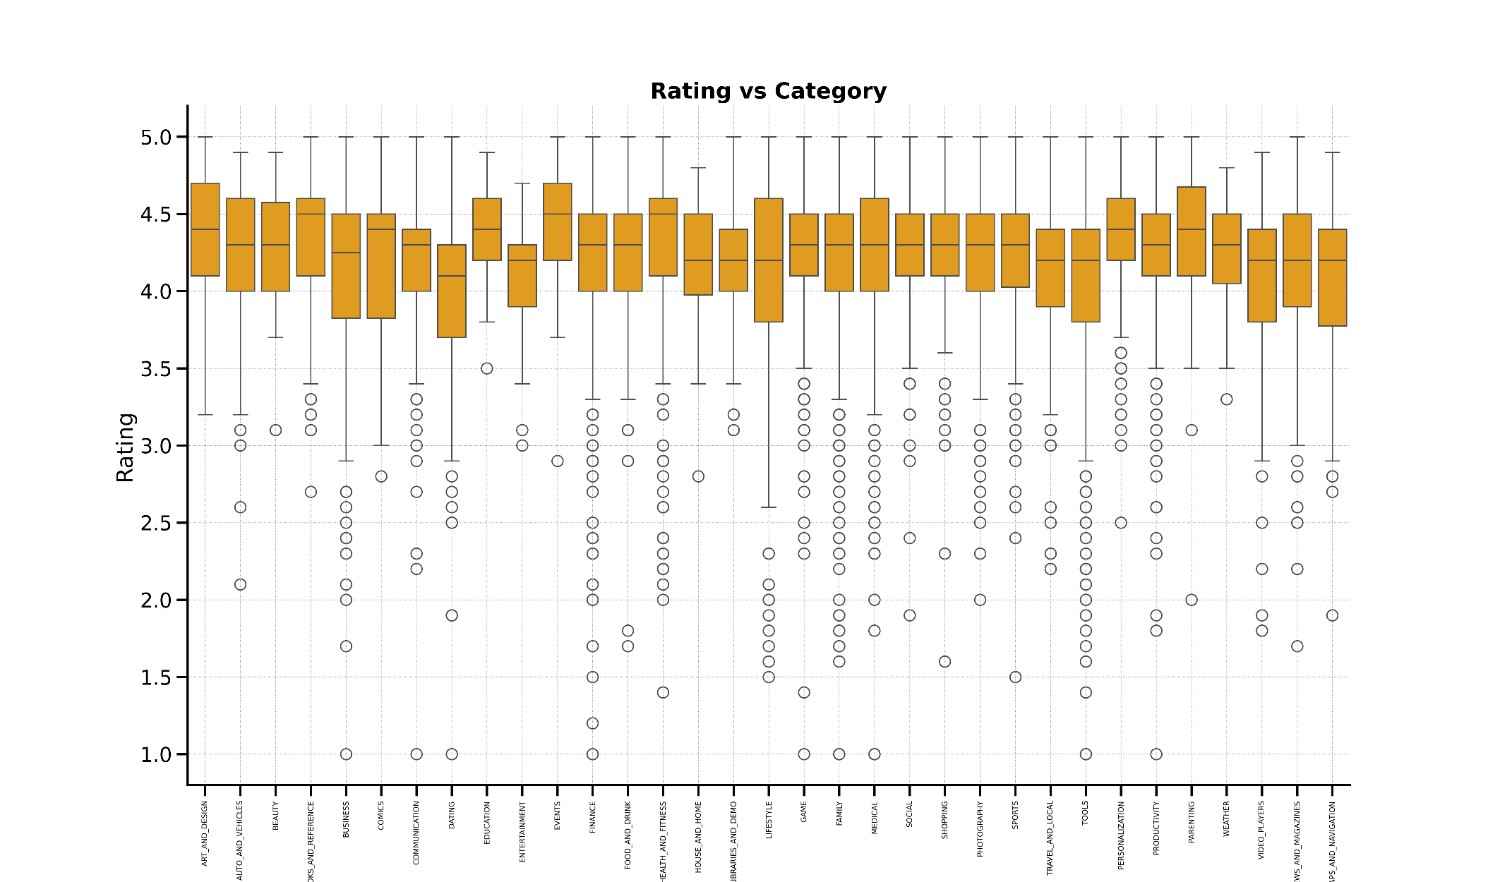
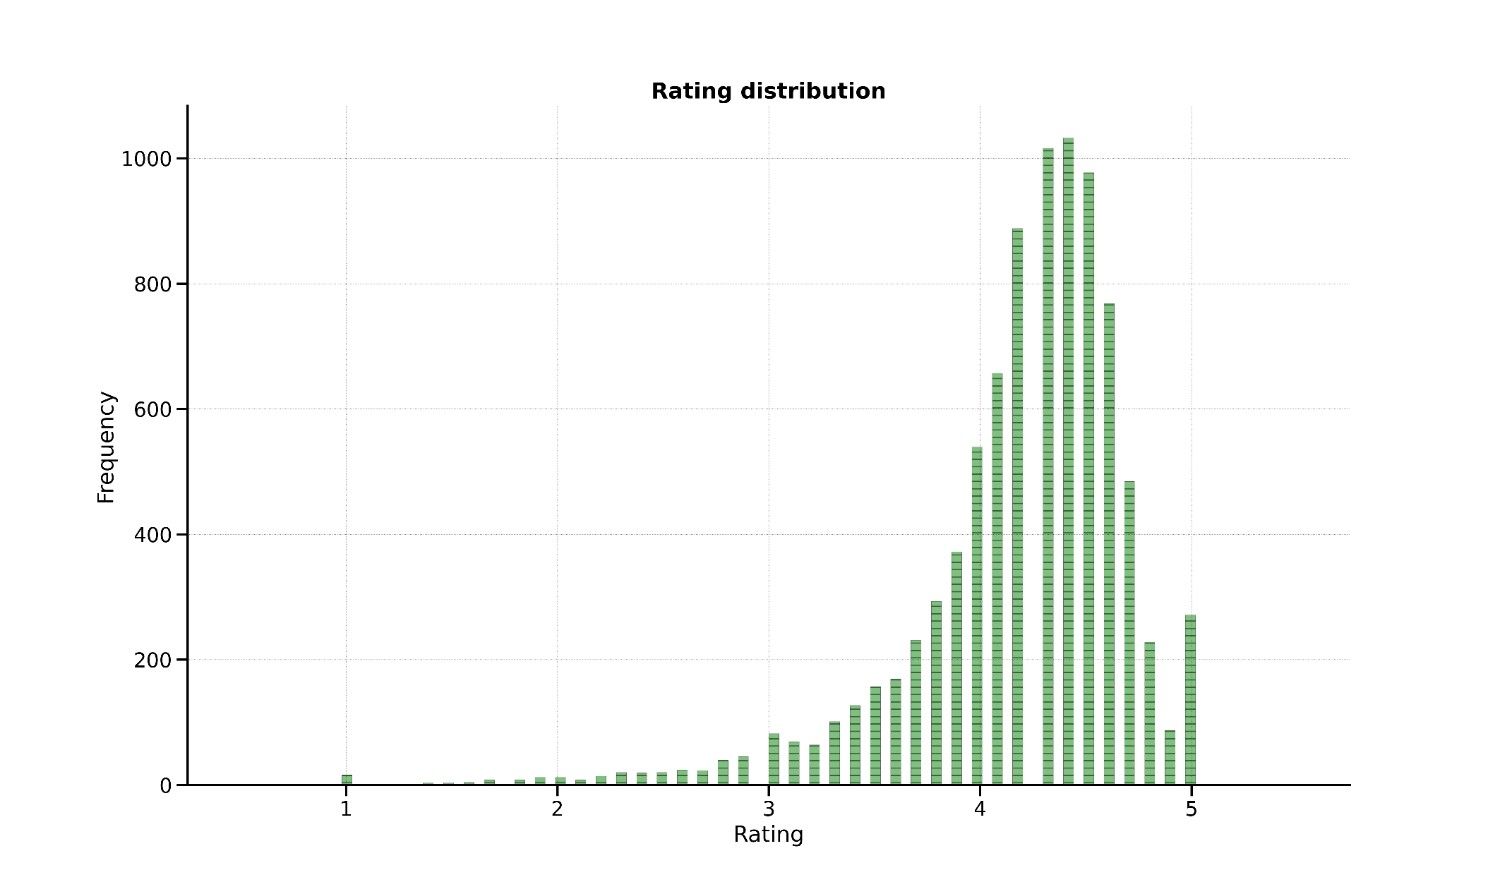
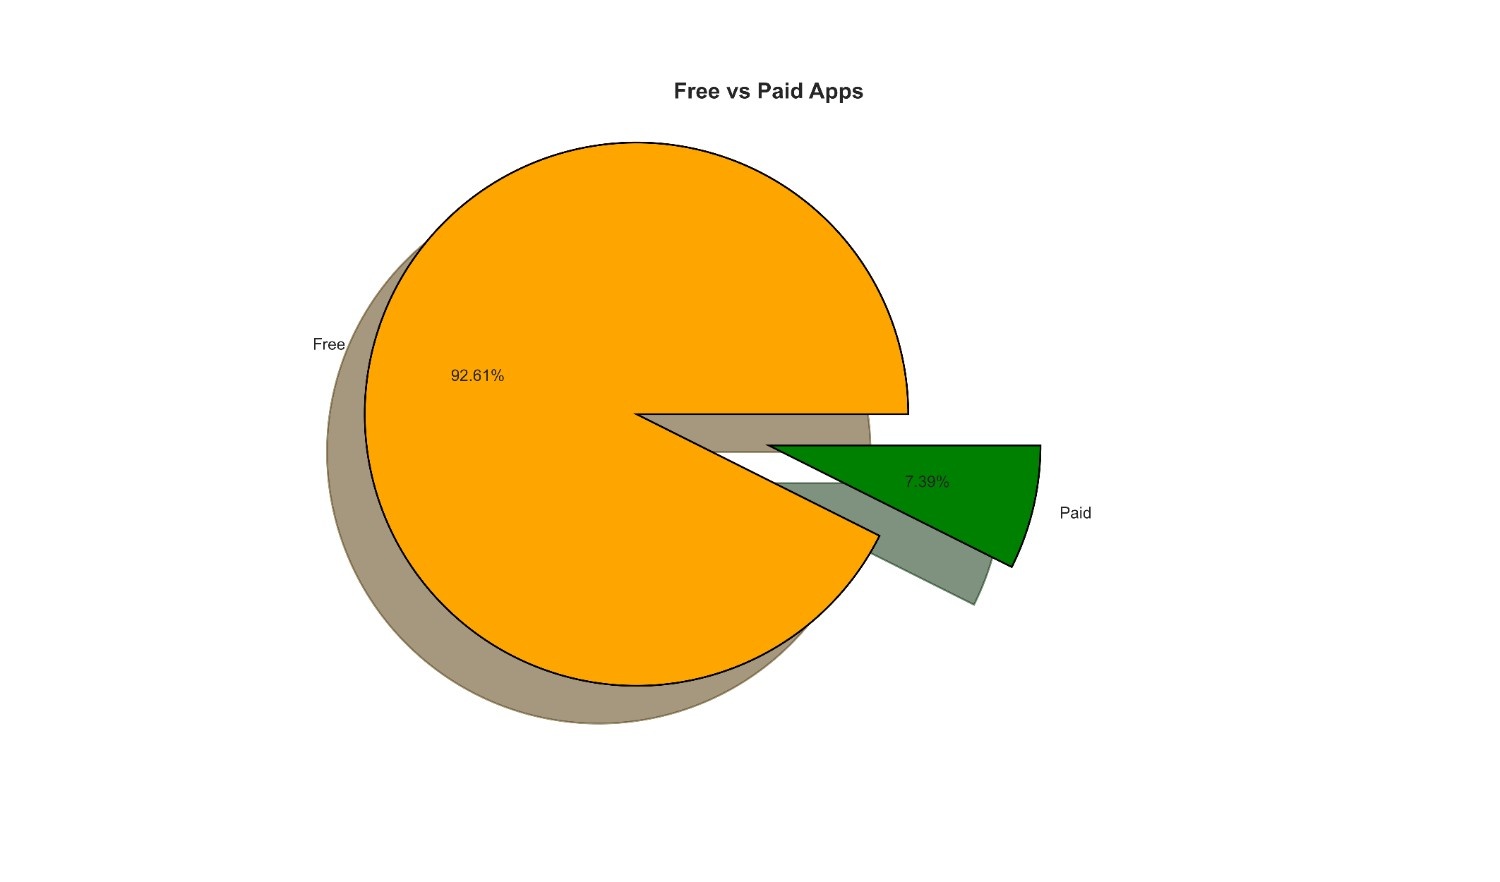
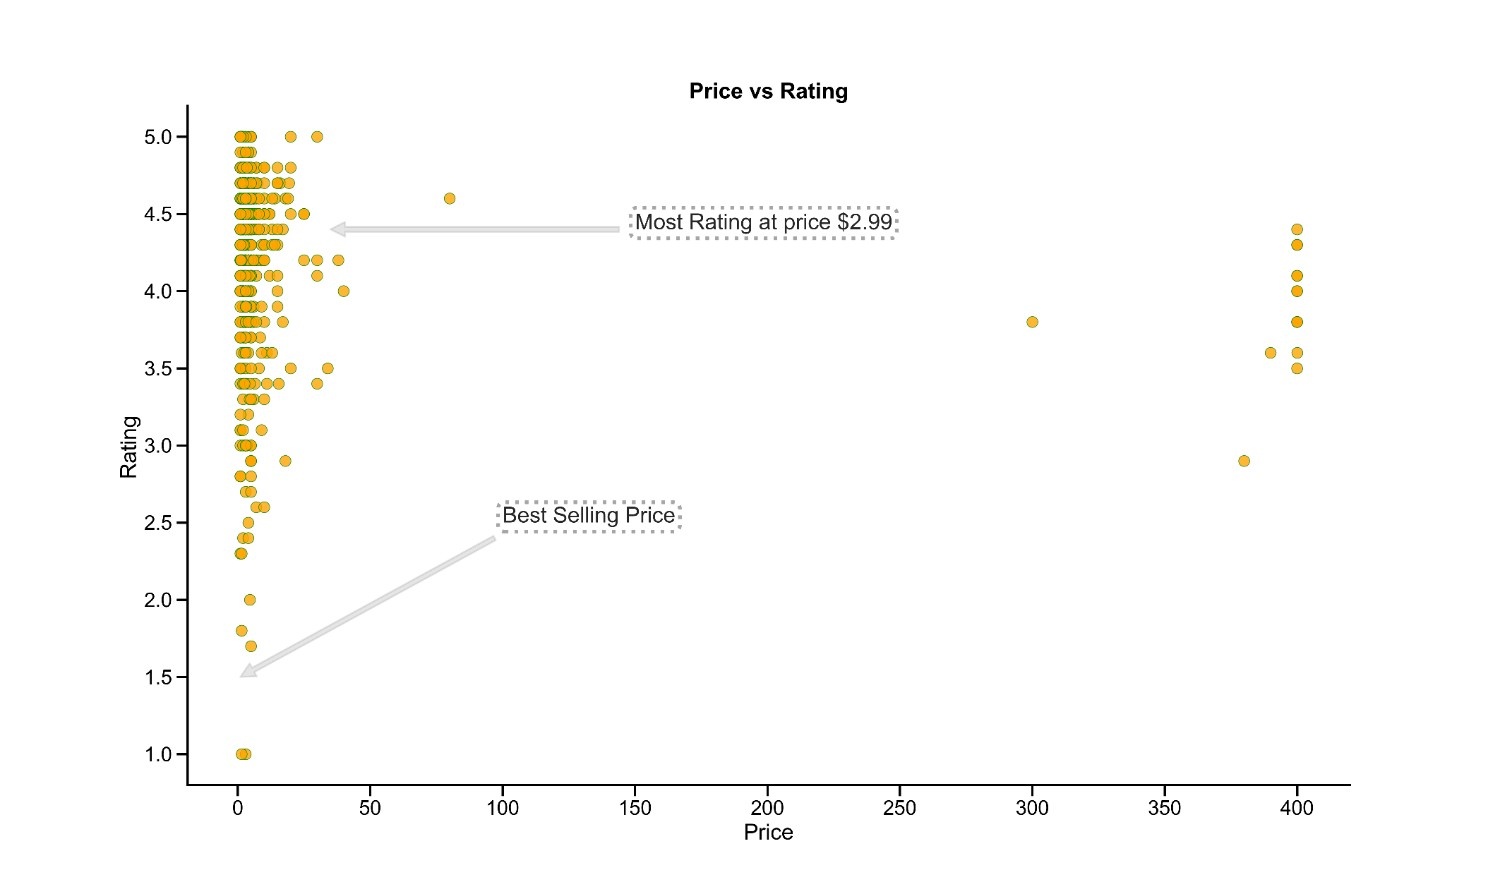
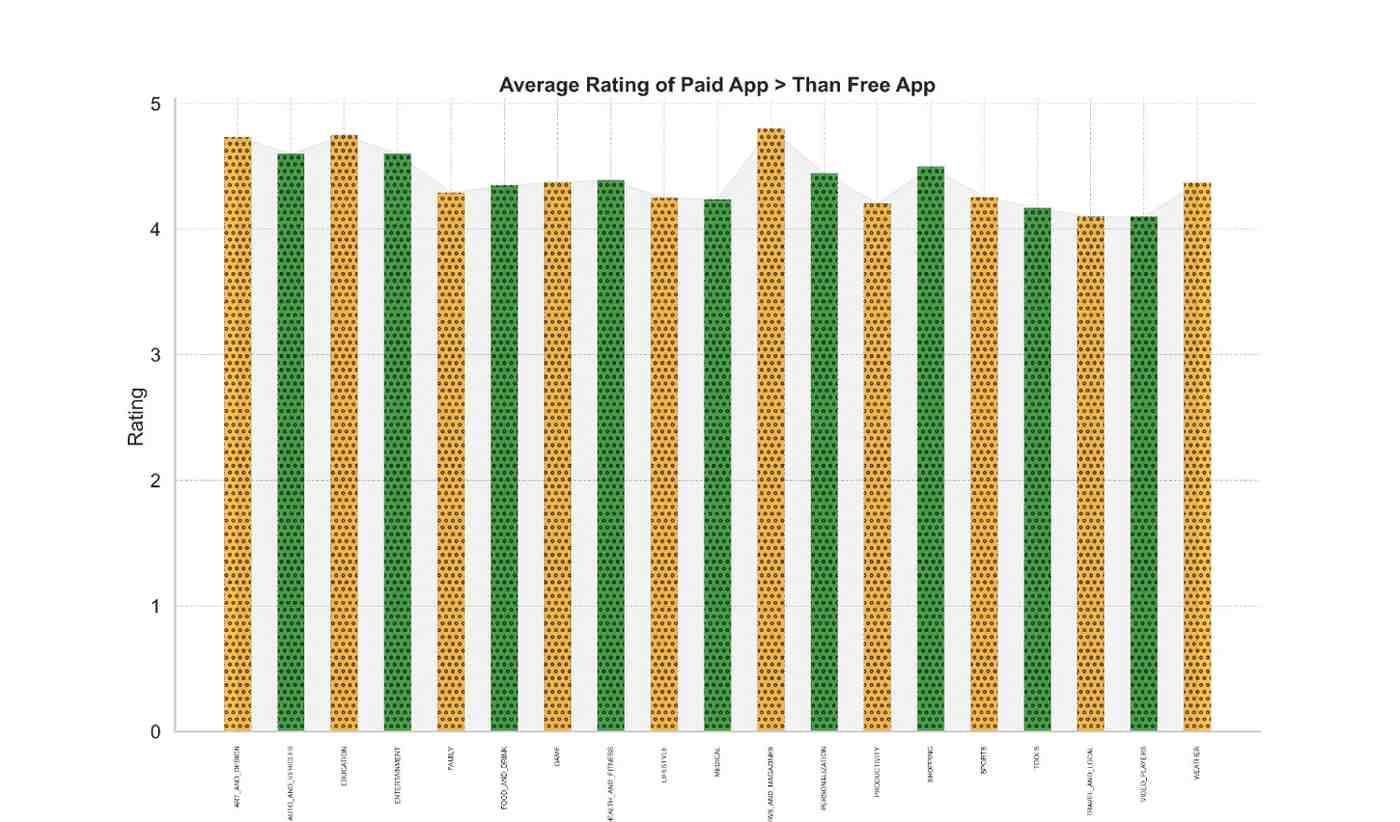
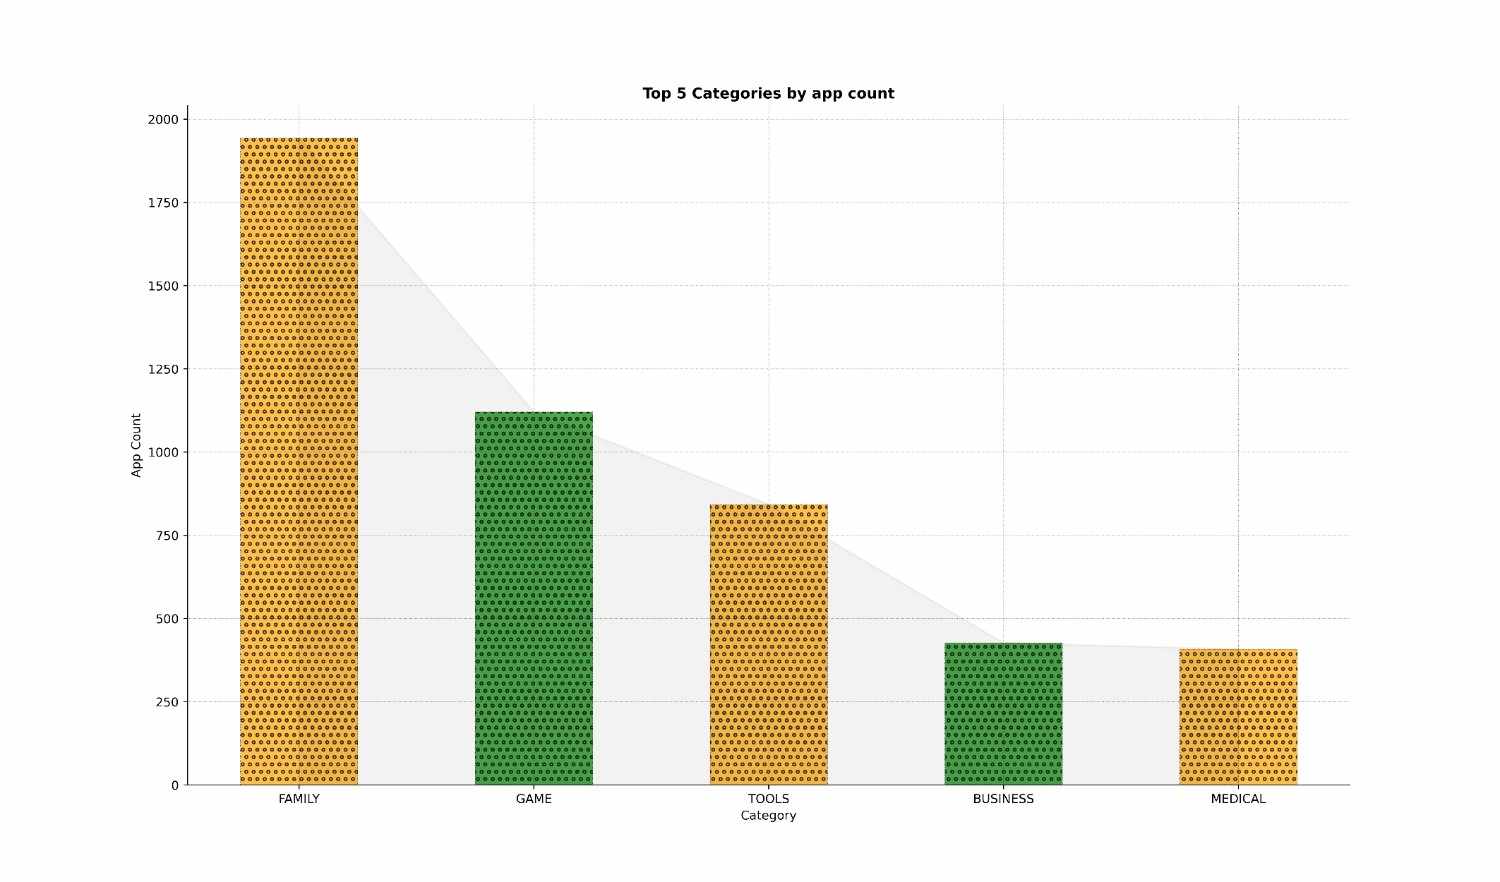
This project analyzes Google Play Store data to explore app trends, user engagement, and pricing insights. The dataset was thoroughly cleaned and transformed to remove inconsistencies, handle missing values, and fix data types. Through detailed exploratory data analysis (EDA), the project highlights category-wise ratings, installs, price correlations, and comparative performance of free vs paid apps using Pandas, Matplotlib, and Seaborn.

Key Features

  • Cleaned and standardized dataset by handling missing values, duplicates, and incorrect entries.
  • Transformed text-based columns like Price and Installs into numeric formats for quantitative analysis.
  • Identified top-performing app categories based on average ratings and installs.
  • Compared free vs paid apps using pie charts and bar plots to show distribution and performance differences.
  • Analyzed relationship between price and ratings, revealing optimal pricing zones for better engagement.
  • Visualized category-wise rating distributions and most downloaded app categories.
  • Detected apps with multiple versions and visualized their install vs rating variations.
  • Used correlation analysis and heatmaps to evaluate relationships between installs, ratings, and pricing.
  • Created clean, annotated visualizations for professional data storytelling.

Screenshots

× Zoomed Project Image